My idle thoughts on tech startups
Facebook S-1: The Most Anticipated IPO in a Decade
The interminable wait is over, and Facebook’s S-1 was filed yesterday afternoon.
I recently wrote a post noting that while the growth cycle of startups has clearly accelerated in the last 5 years, the number of truly monster new businesses (a company ultimately worth $75-100B) remains about the same… it’s a once in a decade sort of thing. My partner Rob also wondered if Facebook is the next Yahoo!, or the next Google. No matter what you think of Facebook’s future prospects, what Zuckerberg & Co. have built in 8 years is truly incredible.
Here’s my first look at Facebook viewed through the lens of their IPO filing. I’ll focus for now on the business itself, there’s plenty of other info on the web if you care to understand the equity ownership or financing history of Facebook and frankly this has been fairly well known for awhile.
===========

Facebook, Inc.
Filing Date: February 1, 2012
Founded: Spring 2004, incorporated July 2004
Headquarters: Palo Alto, CA
What They Do: Enable users to connect and share content with friends online
How They Do It: Operate a social network at Facebook.com, through Facebook’s mobile apps, and the Facebook Platform which lets other websites extend Facebook’s tools for authentication and social sharing
How They Make Money: Facebook’s primary revenue stream is of course selling advertising on Facebook.com, which in total accounts for 85% of revenue. The next chunk comes from Facebook’s platform, in essence “taxing” the revenues of app developers like Zynga, which represents 15% of revenue.
Financial Snapshot:
- 2011 Revenue: $3.71 billion
- 2011 YoY Revenue Growth: 88%
- 2011 Gross Profit Margin: 77%
- 2011 Net Income: $1.00 billion
- 2011 US Revenue = 56% of total, ROW = 44% of total
Notable Aspects of Facebook’s Business:
1) Facebook’s Revenue is “Cleaner” Than Google or Yahoo! – All of Facebook’s ad revenue comes from the Facebook.com website. They don’t even run ads in the FB mobile apps. This is different from companies like Google and Yahoo! who derive a meaningful chunk of their revenue from operating ad networks. These companies report gross ad revenue but then subtract out “TAC” (Traffic Acquisition Costs) which is basically accounting-speak for the revenue share they pay to the partner sites where the ads actually appear. Facebook’s ad revenue is pure… after the cost of running the site is factored in, the rest just drops straight to the bottom line.
Also if you haven’t read it Bill Gurley had an excellent post grading Facebook in the 10x Revenue multiple club, a continuation of his thoughts from before on this topic.
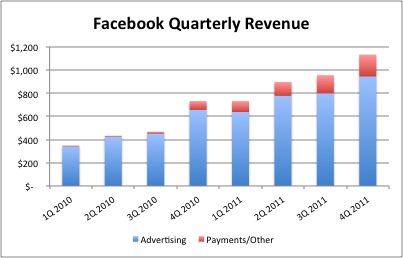
2) Facebook’s Growth is Robust But Lumpy – Facebook’s top-line growth is slowing, but it’s still incredibly high (88% from 2010 to 2011) especially when you consider it’s growing a multi-billion dollar revenue base. This is what Facebook’s quarterly revenue looks like:
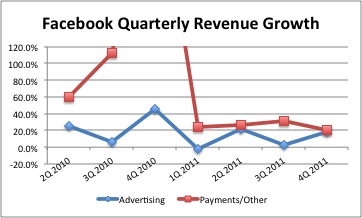
The Payments/Other business essentially had step function growth as Facebook phased in the 30% tax on apps. The Advertising business is growing slower (69% YoY in 2011) than the whole company and if you dive in to the quarterly growth rates, you can see that it’s fairly lumpy. Facebook admits as much that the ad business, which again accounts for the vast majority of revenues (85%), has seasonality in line with the media industry generally with a strong Q4 and weak Q1. In fact Facebook’s ad revenue dropped in absolute terms slightly (about -3%) from Q4 2010 to Q1 2011.
Again, let me be perfectly clear… Facebook’s revenues are still growing very robustly, even the advertising business. The overall growth in Payments clearly helps smooth out some of the ad revenue seasonality. But it’ll be interesting to see how public market investors react when Facebook files an amended S-1 pre-IPO with Q1 2012 numbers, particularly if there’s similar Q1 slowdown in ad revenue.
3) Employee Stock Purchases Are a Near-Term ATM – Facebook has issued a combination of stock options and more recently restricted stock units (RSUs) as compensation to employees. Obviously depending when an employee was granted equity, the exercise price they’d have to pay to actually purchase and own these shares outright could be quite high since Facebook’s company valuation grew rapidly. As a result, the amount these employees pay the company for these exercises is non-trivial… in 2011 these common stock purchases generated about $1 billion in cash for Facebook. To put that in perspective, Facebook’s overall operations (which are highly profitable) generated about $1.5 billion in cash profit last year.
Without knowing more details about the employee equity plans, it’s unclear how much more cash of this nature could come in during 2012 or 2013. Plus Facebook has ample cash on hand today and will get a huge slug more from the IPO.
4) $600M Buys a Lot of Data Centers – It’s widely known that Facebook invests heavily in it’s technical infrastructure and operates it’s own data centers. We didn’t know exactly how much that was but it turns out Facebook invested over $600M in data center infrastructure last year. That’s the capex (e.g. new stuff they built or bought), the operating cost of staffing and running these things is on top of that (that’s baked into cost of revenue).
5) Zynga/Games Revenue Concentration – Other folks have already written about the fact that Zynga accounts for 12% of Facebook’s total revenue, which would be about $450M in 2011. That’s actually a combination of Payments (the 30% share Facebook takes from app developer revenues) and advertising spend for ads Zynga buys on FB to acquire customers. Back of the envelope, Zynga did just under $1B in revenue in 2011 so 30% of that is something like $330-340M. So presumably they spent about $100M give or take on FB ads on top of that.
Facebook disclosed in the S-1 that games (as opposed to other kinds of apps) account for substantially all of the Payments revenue and Zynga accounts for most of that.
6) US Usage Slowing, OUS Still Accelerating – Facebook has a lot of users, and their users are on Facebook a lot… no shocker there. The headline stats have been out in the public domain for awhile – >800M users, more than 50% log in daily, around 50% access on mobile devices at least some, etc. If you want to dig in yourself there’s a bunch of charts in the S-1 starting on pg. 44 but I’ll give you the headline view because that’s probably why you’re reading this post.
US user base is still growing, but it’s clearly slowing as Facebook approaches saturation. Facebook estimates they already have 60% of addressable US internet users. Internationally Facebook’s user growth is still accelerating, but there are clear regional differences. In fact penetration in Chile, Turkey, and Venezuela is estimated at >80% which is astonishing. But places like Brazil and India are estimated at 20-30% and Japan and South Korea at <15%. The big gaping whole is of course China where Facebook has “near 0% penetration”.
Note: None of this should be construed as investment advice to buy or sell any stock.


