My idle thoughts on tech startups
Groupon’s S-1: From Zero to Like… Billions in 30 Months
So Groupon obviously filed their S-1 the other day to formally being the IPO process. Even for those who don’t care to dive into the numbers, it’s worth a quick glance because co-founder/CEO Andrew Mason wrote a letter which forms the preamble of the full document. A good read on his philosophy and how they intend to continue building the company.
Groupon’s become a juggernaut in the immense local marketing space. They’ve grown from nothing to >$2B in revenue in 30 months time, making the company among the fastest growing businesses in the histroy of the world. They face lots of competition and few barriers to entry so the future growth and profitability can legitimately be questioned, but still… what Andrew Mason and the rest of the team have built in such a short time is truly remarkable. It also puts another chink in the armor of the meme that monster internet companies can only be built in Silicon Valley (LivingSocial, Kayak, Gilt Groupe, CSN Stores, et al doing damage here too).
The company is currently unprofitable, though generating meaningful free cash flow. When you’re company is growing >10x year over year, I suppose if management didn’t invest a lot in continued growth their board directors would line them up against the wall. The topic of how profitable Groupon could be in the future is a more complicated and subjective one, so I will save that for a follow-up post.
Without further ado, my “Cliff Notes” style deconstruction & summary of the 150+ page filing.
=================

Groupon, Inc.
Filing Date: initial filing June 2, 2011
Founding Date: 2009
Headquarters: Chicago, IL
What They Do: Deeply discounted coupons (often 50% off redeemed value) for local merchants
How They Do It: Build email list of consumers interested in local deals (mainly via paid search & social network ads), sell coupon programs to merchants via telesales
How They Make Money: Groupon keeps a share of the coupon value (typically 40-50%) as its net revenue (1)
Financial Snapshot:
- 2010 Revenue: $713M
- Run Rate Revenue: $2.6B (Q1 2011 annualized)
- Revenue Growth: 2241% YoY (2010 vs 2009), 1357% YOY (Q1 2011 vs Q1 2010)
- 2010 Gross Profit: $280M
- Run Rate Gross Profit: $1.1B (Q1 2011 annualized)
- Gross Profit Margins: 42% (Q1 2011), 39% (2010), 36% (2009) –> i.e. for every $1 of Groupons sold, the company currently keeps $0.42 in net revenue and passes $0.58 to the merchant
- 2010 Net Income: -$389M (net loss) (2)
User & Merchant Statistics:
- Subscribers (end of period): 83.1M (Q1 2011), 50.6M (2010), 1.8M (2009)
- Cumulative customers (unique buyers of Groupons): 15.8M (Q1 2011), 9.0M (2010), 0.4M (2009)
- Featured merchants (may not have tipped): 56.8K (Q1 2011), 66.3K (2010), 2.7K (2009)
- Groupons sold: 28.1M (Q1 2011), 30.3M (2010), 1.2M (2009)
Notable Aspects of Their Business:
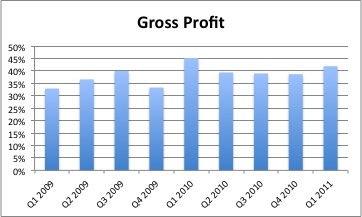
1) Gross Profit Direction? One of the frequent questions raised about Groupon is what their long run gross profit margins may look like. Many believe that their margins will erode from 40-50% over time due to competition, merchant fatigue, or other factors. While gross margins have declined slightly YoY (42% Q1 2011 vs 45% Q1 2010), it’s hard to discern a pattern when you look at the last 9 quarters.
2) Groupon’s Far More International Than Most Realize: Most casual observers know that Groupon’s been buying similar daily deal businesses in other global regions (starting in May 2010), and doing some organic expansion internationally too. But it turns out the majority of the company’s revenue comes from outside the US & Canada… about 54% of revenue in Q1 2011 came from the International segment (non North America). The International segment appears to have similar profitability as the North America business though as it accounted for roughly the same proportion of adjusted operating income.
3) Groupon’s Business is Like An ATM: Groupon is currently unprofitable on a GAAP basis thanks to acquisition related expenses in 2010 as well as ongoing marketing spend to acquire customers. The latter are included in free cash flow whereas the former are excluded, since they’re one-time in nature and it’s possible stock is used instead of cash for acquisitions. Groupon generated $72 million in free cash flow in 2010, or slightly more than 10% of their revenue. In addition, Groupon has a favorable cash cycle as they collect cash up front from consumers but don’t have to pay merchants for awhile (in US typically 60 days, int’l usually upon consumer redemption).
4) Unique Reporting of Accounting: Much has been made in the press that Groupon has chosen to report alternative non-GAAP metrics in addition to GAAP accounting. Specifically Groupon reports “Adjusted Customer Segment Operating Income” or Adjusted CSOI… in essence this is just a unique form of Adjusted EBITDA which many businesses report. The latter typically excludes taxes and non-cash expenses like taxes, depreciation, stock option compensation, etc… Groupon’s Adjusted CSOI is exactly the same but also excludes customer acquisition costs (though these are reported elsewhere).
IMO this is much ado about nothing, as any comptentent analyst can look at Groupon’s GAAP and non-GAAP metrics and get a good sense of the business. Companies like Google do the same thing when they report certain aspects of their business which are not easily expressed in traditional GAAP terms. For example Google (and others) report a figure called Traffic Acquisition Costs (TAC) which is a non-GAAP measure of how much revenue Google pays out to website publishers in Adsense or other programs.
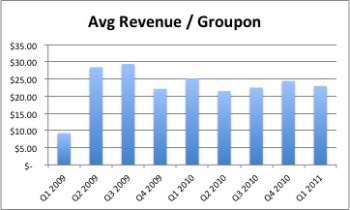
5) Value of Groupons Has Remained Steady: Another question that’s occasionally raised about Groupon’s business is whether the value of deals is falling, as the “low hanging fruit” of more valuable deals is picked. At a corporate level the actual revenue per Groupon has remained fairly steady in the $22-25 range (individual markets show varying trends – see #6). Again the exact offer varies, but assuming most Groupons are still sold at roughly 50% discount from face value that means the value of Groupons being sold to consumers has remained in the $45-50 range.
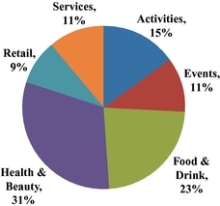
Groupon’s known for offering deals to restaurants and spas primarily and those two still make up a slight majority of offers on a unit basis. But other categories make up a healthy chunk of the offer mix. We unfortunately don’t know how the pie breaks down on a revenue basis.
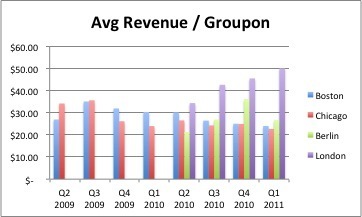
6) Per Market Analysis: We unfortunately only have data on four of the hundreds of different cities in which Groupon operates… two US (Chicago, Boston) and two international (Berlin, London). Other markets may be performing very differently, and Groupon states that there are variances based on the maturity and size of each market (common sense dictates as much). The folks at Yipit did a detailed analyis of the Boston data and concluded Groupon’s model is deteriorating there. Keep in mind Yipit is an indirect competitor in the daily deals space (essentially a meta aggregator of deals sites), but the analysis is sound IMO. The question though isn’t whether as markets mature the model deteriorates… it’s whether it’s still exciting in absolute terms.
Revenue per Groupon sold is clearly declining in mature markets like Boston & Chicago, though it continues to grow in London and presumably at least some other newer markets. But even in Boston & Chicago it remains above $20.
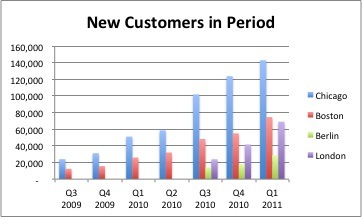
The absolute number of consumers buying a groupon continues to grow dramatically even in mature markets. It’s impossible to do a pure cohort analysis with the S-1 data, but as you can see the number of new buyers of a Groupon in a given quarter is still on the rise for Boston & Chicago. Keep in mind the distinction between a “subscriber” (consumer who opts-in to receive Groupon’s deal emails) and a “customer” (one who’s actually bought a Groupon). The S-1 reports cumulative customers, but the chart below shows new customers in a given period regardless of when they became a subscriber.
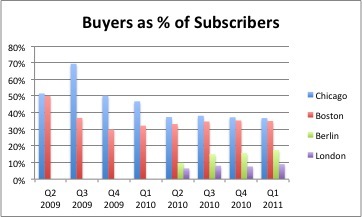
Also the proportion of email subscribers who’ve bought a Groupon has held up reasonably well. Over time you’d naturally expect some decline as people who signed up as subscribers churn or “fatigue” and keep in mind the chart below is cumulative (i.e. % of total subscribers who’ve bought at least 1 Groupon, regardless of when they subscribed or bought). But for Boston & Chicago about 1/3rd of the subscriber base has bought a Groupon, and the % has held pretty constant despite continued rapid growth of the subscriber base in these markets.
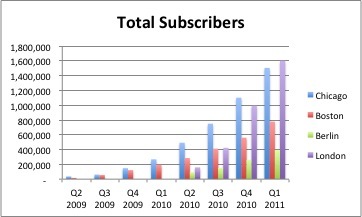
Keeping a fairly high % of subscribers as buyers directly impacts lifetime value of a customer (LTV). In Q1 2011 Groupon was acquiring new subscribers for $5.53 and again only a portion of these subscribers will ultimately buy a Groupon, so the cost to acquire a true customer is higher than that. But if the proportion of buyers to subscribers is fairly high and doesn’t drop rapidly, the LTV presumably can sigificantly exceed acquisition costs.
7) It’s All Relative: It’s easy to write headlines like “Groupon’s growth rate is dropping like a stone… Q1 2011 growth rate barely half 2010”. That statement is factually correct but we need to keep all aspects of Groupon’s remarkable business in perspective. Forget doubling, forget tripling… despite a decelerating growth rate in Q1 2011 Groupon still posted 13X year over year growth. If Groupon’s growth rate drops by 80% they’ll still be nearly tripling top line sales in 2012.
Notes: None of the above should be considered investment advice or a recommendation to buy or sell Groupon stock.
- Keep in mind Groupon’s net revenue is a percent of a percent. If the a Groupon is worth $50 of goods or services (face value), the consumer is likely paying $25 (gross revenue), and Groupon is likely keeping about $10 of that (gross profit or net revenue) and the merchant gets the other $15.
- Groupon’s 2010 net loss includes $203M expenses related to acquisitions of several deal businesses.
